Vertex Scavenger Hunt

Last year, the great Mrs. McCuaig created an activity for linear systems for her 10 enriched class. It involved students solving linear system questions and using a map of the school to locate the next clue.

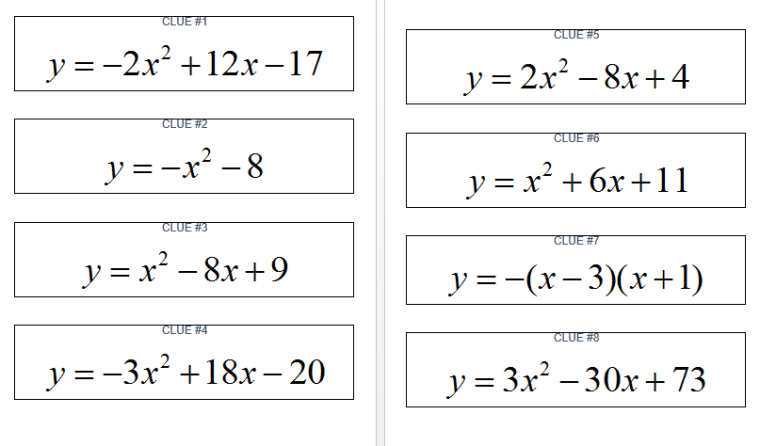
This is my first time spiraling the MPM 2D (Grade 10 Academic Math) course. We have completed all of the quadratics expectations so we are doing some activities to review key concepts. One of the concepts is determining the vertex of a quadratic given various forms by completing the square or using the axis of symmetry if the quadratic is in factored form. I decided to come up with a scavenger hunt using the maps from the linear system activity. A map of the school was taken and then a photocopy of graph paper was placed on a transparency to create a grid overlying the map of the school.

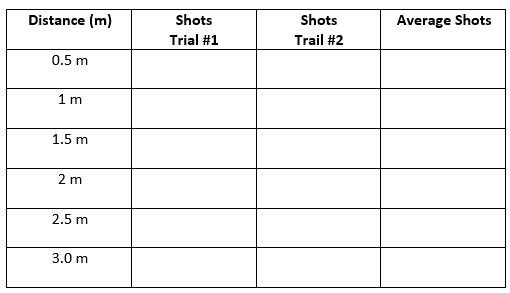
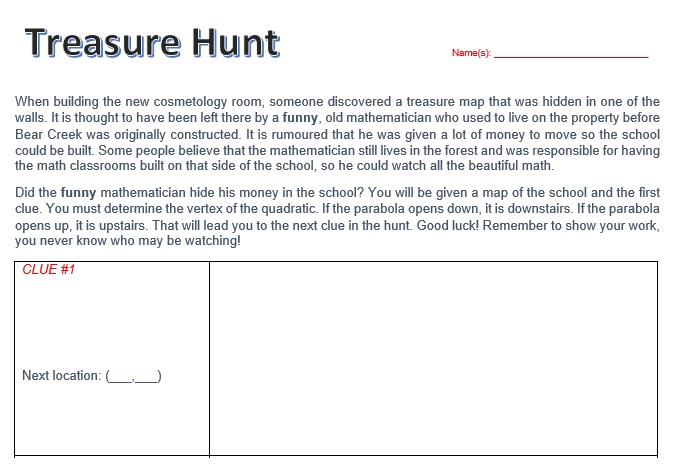
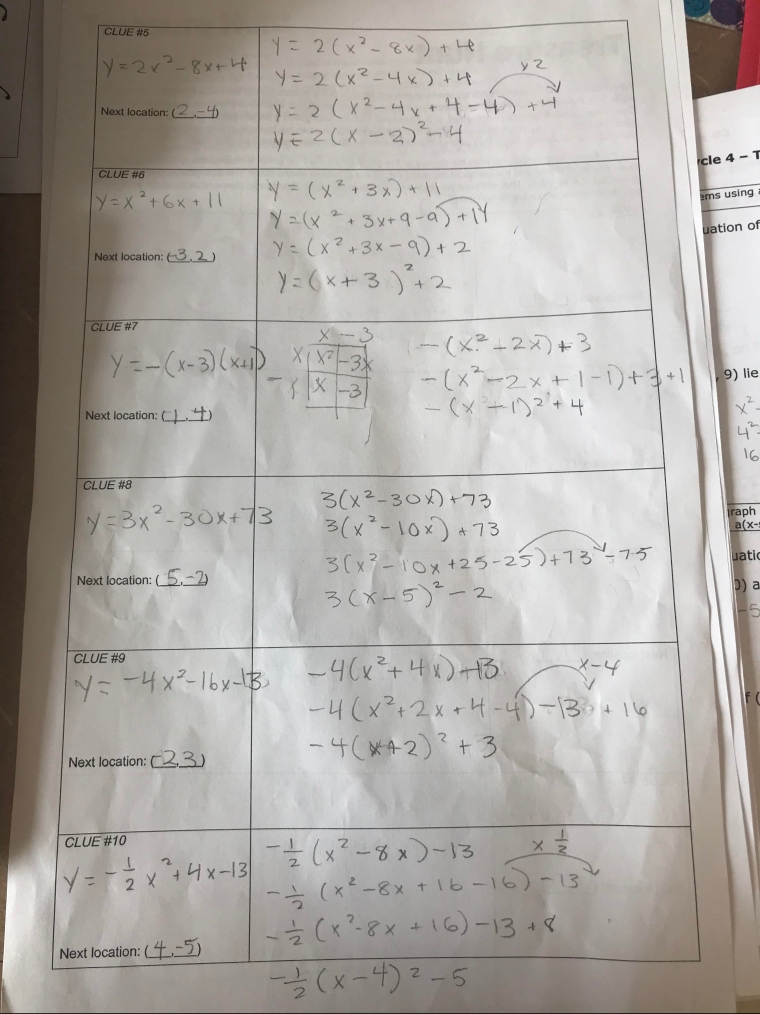
Each group was given a sheet to keep track of their work on. This was the same handout used for the linear systems version.

treasurehunt

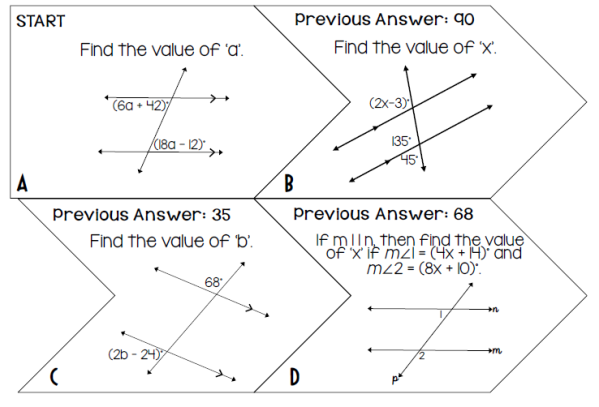
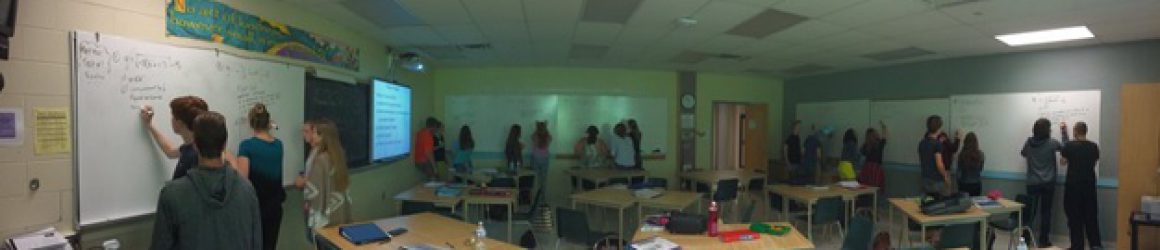
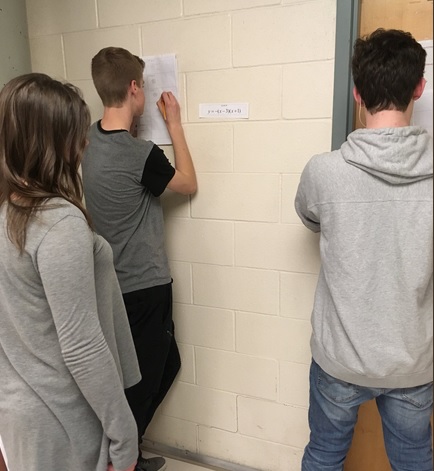
There are 10 clues posted around the school. I gave each group a clue to start at their desks before they went to the next clue. To find the next clue, students found the vertex by completing the square, or finding the axis of symmetry, and if the parabola opened down the clue was downstairs and if the parabola opened up, the clue was upstairs.

clues

The clues led to places that were well known (cafeteria, cosmotology room, main office, math help room, etc.).

scavengerhunt

It took most of the period to complete this. It was an excellent activity. Nothing like a little friendly competition. I suppose you could just give them a sheet with 10 questions on it to do, but where is the fun in that!

page3.jpg

The activity takes a bit of setup. You have to make a grid map for your school, find the coordinates you want to use of key locations, make the questions up and make sure that clue 10, leads back to clue 1, etc. I did the questions like 10 times and still managed to have a sign error! GRRR. Oh well, now it works perfectly for next year.


MPM 1D – Performance Task

It is hard to believe it is almost the holiday break. My students are writing their Cycle 4 test on Tuesday (weather permitting). It’s that time of year where you never know when you might get a snow day. The majority of Cycle 5 will consist of activities and good questions that will help consolidate all of the concepts we have learned. We have pretty much covered everything by now.

During the last cycle we had a performance task. I ran this assessment last year but I changed it a bit this year. The task was split over 2 days.

Day 1 – Group Portion

Students were given the following problem. I believe I got it from Thach-Thao Phan when we visited Glebe Collegiate 2 years ago.

performancetask

Students completed this on the VNPS and I provided them chart paper to tape up so they could do the graph. I was so impressed by how well they worked together and with their collaboration. The tricky part was realizing that you would need Pythagorean Theorem for the lengths of 2 of the sides of the triangle.

Students also had trouble finding a line perpendicular to y = 5. They knew y = 5 was a horizontal line and that the perpendicular line must be a vertical line, but they always seem to struggle with the fact a vertical line is x = a. I brought them together and we consolidated this and made the connection that it is always just the x-value.

I circulated and recorded observations. While this portion is mainly formative and allows them to prep for the independent part, I have been working on tracking more formative assessment this year.

Day 2- Independent Portion

I used the group portion question to come up with a similar type of question for the independent part. Students received the following.

performancetask1

Once they completed their graph they handed this in to receive Part 2 of the assessment. I didn’t split it into 2 parts last year, but found that the students who messed up some of their graph had difficulty completing the remaining portion.

IMG_4419IMG_4420

Unlike the triangle, they got a rectangle with this one. Part 2 consisted of the graph already complete.

performancetaskpart2

Some students wrote a ton for (b) “How do the lines compare?” I always tell them to “tell me as much as you know” and “never leave anything blank.” I think the open ended questions are hard to tell when you have answered the whole question.

IMG_4421

Again, students needed to find the area and perimeter of the shape. Next year, I will add to prove it is a rectangle using diagonal properties.

This went extremely well. I really like having the two days where they are able to collaborate prior to completing the independent portion.

I’m already thinking about second semester. I don’t have a 1D (sad face), but I am excited to try the MHF 4U course in the spiraled fashion. I teach the enriched version of the MHF 4U/MCV4U, which is a whole year AP calculus course. I have a 10 academic so I may give that a go and use some of Mary Bourassa’s resources and try spiraling that. With a new addition coming to the family in May, I will have to see how much free time I have. As t goes to infinity, that limit may be approaching 0.

Assessment & Evaluation in MPM 1D

When we began spiraling 2P math two years ago, we also looked at changing our assessment practices. We previously had given unit tests and graded them based on the four achievement chart categories (Knowledge/Application/Thinking/Communication). Once we switched to spiraling, it seemed to make more sense to organize the questions based on the overall expectations covered during that cycle. The tests still contain questions from all areas of the achievement chart though. This seemed to be the way other teachers were doing it who were also spiraling in other boards.

test1

We had parent-teacher interviews last week. I had a record number of parents, which is great to see! I used to use Markbook to record grades. I liked it because I was able to provide students with a printout of marks. This was especially great to have something to hand out to parents at parent night. Since I now use excel to track achievement, I didn’t have a convenient way to print out an update for students. I had developed a word document for 2P, so I converted it so I can use it in 1D. It tracks achievement by the 11 Overall Expectations for the course, as well as, somewhere for learning skills and comments/feedback.

pr.png

My plan is to eventually allow an area for students to reflect and fill out the next steps themselves (possibly in conferencing type situation).

I have also coordinated my excel file to colour code cells for easily noticing areas of need for each student.

excel

I was able to set up a mail merge feature in word so that it reads from the excel file and prints out the 30 progress reports in a matter of seconds. The coding took some time, but now that it is set up, it is pretty easy to run reports. I plan to provide these to students and parents after each cycle.

I also track a lot of formative assessments. I provide students with “quizzes” that are not graded. I write feedback all over them and it was one thing that students mentioned a lot at the parent-teacher interviews. They liked having the “no stress” situation and ability to self-assess where they have gaps before the test.

Planning to try a new activity soon. Barbie wasn’t overly “thrilled” with her last bungee adventure.

barbie


MPM 1D – Cycle #1 Results

This is my second semester through spiraling the Grade 9 Academic course (MPM 1D). For the most part, I have kept the sequence of activities the same, but I did change a few things. Some activities that we did later in the course (when the weather was nicer), I am moving to earlier cycles while the weather is still nice.

We just finished our first cycle and I am so happy with the test results. The overall average was 85% (Number Sense – 89%, Linear Relations – 79%, Measurement – 87%). The test covered quite a bit of content: scatter plots and LOBF, trends and relationships, graphing simple lines, exponent rules, ratios and rates, surface area and Pythagorean theorem. One thing I have noticed since beginning spiraling, there were no blank answers on any of the tests. In addition, the students seem far more confident in their abilities.

We recently received our EQAO data from last year. We spiral both the grade 9 academic and applied courses at our school. Our applied math scores were up 5% from the previous year and our academic scores were up 4% from the previous year. Spiraling for the win!

If you are interested in spiraling other courses, a colleague @MisterTieGuy is blogging about his MBF 3C (Grade 11 College Math) course. I highly recommend you check it out.

My Top 5 Defining Moments

@MrSoclassroom recently blogged about his top 5 defining teaching moments. I thought I would chime in as it is a good way to reflect

Vertical Non-Permanent Surfaces & Visible Random Groupings

I think everyone is familiar with Alex Overwijk. I saw him speak many times at OAME about how he was revamping his 10 applied math course. Over a year ago we decided to jump in and try it. We started renovating 1 room and replaced bare walls and bulletin boards with whiteboards. Jump ahead to today and we have all but one of our math rooms set up for VNPS. Watching the students collaborate on problems at the whiteboard has improved everything from engagement to assessment. As I have some enriched classes this semester, I have found Peter Liljedahl’s site extrememly helpful for putting together some great thinking classroom questions for the first day of classes.

Spiraling & Activity Based Teaching

The first course we tried spiraling with was 10 applied math. We followed Mary Bourassa’s resources and added some other activities from Jon Orr and Alex. This was generally the course we saw poor engagement and results when it comes to students being successful. Both of these have increased dramatically, as well as, attendance. When I taught this course last semester, all but one of the tests had perfect attendance. Students were more confident in their math abilities and enjoyed coming to math class. Looking forward to continuing to develop the grade 9 academic course this semester.

Twitter

Now, I originally started my twitter account for the purpose of sharing my hilariously funny jokes outside of the classroom through the hashtag #funnyhogg. However, I find myself doing this a lot less (probably because I have exhausted most of the math jokes). So until I teach chemistry, I will have to work harder to find jokes (but even all the good chemistry jokes argon). Twitter has become so much more for me, it’s how I follow so many great educators who share their effective teaching strategies. The hashtag #MTBoS and so many others have helped me find great activities, resources and people to collaborate with.

Classroom Visits

A year ago, myself and 2 other teachers travelled to Ottawa for 3 days to visit Alex Overwijk’s classroom. As we were embarking on the new journey of spiraling our courses and using VNPS and VRG, it was a great opportunity to see this in action. We visited his classes for 2 days and spent a half-day chatting with him. It was so amazing to see the engagement and how well students collaborated. Since returning to our board, we have had quite a few visits from teachers from other schools. I encourage everyone to open their classrooms up to visitors. We can learn so much from each other and I often feel that we worry about being “judged.” I also love visiting other teachers’ classrooms and this is something I would like to continue doing moving forward.

Assessment

When I started teaching, I was extremely worried about making sure I had enough data in my mark book to calculate a final grade. I have spent the last year working to change how I value assessment and evaluation. This is something I need to continue to work on, but I no longer worry about what is in my mark book. There are a lot of people going “gradeless,” but I’m not sure I’m ready to do that. I give a lot of formative quizzes in my classes where I just write feedback on them and record them. I am working on google form that I can use as I walk around while students are working on problems with their VRG. I also tried conferencing for the first time last year after one of our tests. Hoping to continue this as we move into the new school year.

Fast Walker & Painted Cube

Fast Walker

Last week, I wrote briefly about “fast walker,” an activity I created on a whim so that we could go outside and enjoy the weather. It involved having students time how long it would take them to make a lap of the 400m track. We came back inside, they found their rate and we did some graphing of total distance traveled vs. time.

When we came back on Monday, I wanted to add to this activity.  I gave them the following question:

fastwalker2

I didn’t give them much direction on this, so most simply found the head start in time. This is the easier question and I was hoping for the distance. After they found the time, I told them to find the distance of the head start you would need in metres.

fastwalker3

The students found how long it would take the runner to run 400 metres and then used that POI to find the initial value for their equation. For my rate of around 1.33 m/s, I would need around a 266.66 metre head start. Good review here of partial vs. direct.

Next it was on to some area and perimeter questions. I asked them the following two questions.

fastwalker4

Solving for the radius in the first question was a bit tricky but they did a great job!

Since we were graphing distance-time, I decided it would be a great opportunity to review distance-time graphs and graphing stories. I gave them 4 graphs to review.

fastwalker5

For an activity that was just suppose to be a way to get outside for a bit, it actually turned into a great activity covering quite a few expectations in the course. Nothing like math and a spark break all in one.

Painted Cube

We do a variation of this activity in our MHF 4U course. Students completed the following chart. Most built the cubes using cubilinks to find the number of cubes with paint on them.

paintcube1

Once they had the chart, we tried to come up with the general rule for each column for any side length n. I was impressed by how many students went straight to finding the differences to see if there was some type of a pattern. They found the first 3 quite easy and we had to look at finding the last two together.

paint2.png

We then graphed the 4 relationships and compared the graphs (linear vs. non-linear) etc.

paint3

There were some great questions here that would be great to dive into with an enriched class (domain, etc.)

A great activity to review linear and no-linear relations, first differences, graphing and equations.

This week we will be having a performance task. The plan is to allow students a period to work with their VRG to complete some higher order thinking questions. They will then have to complete an individual assessment the following day that has a similar flavour to the questions they were working on in a group.

It is also OAME this week, so 4 of us will be travelling to Kingston for some math education. It’s always great to hear the amazing things going on in other boards.


Fast Skipper & Fast Walker

This week students wrote their third cycle test. We are pretty much done the course. We’ll spend the next two cycles reviewing and developing a deeper understanding of the expectations.

Cycle Test 3

The cycle tests are definitely starting to look like a final exam. The most recent test consisted of questions from all 4 strands. Report cards were handed out this week, and I must say, that grading the tests by expectations makes it a lot easier to write comments.

Fast Skipper

This was an activity we created last semester. I wrote a previous blog post about it so I won’t go into much detail. It involved viewing the world skipping record and trying to determine our own skipping rate.

graph

Always nice when you can incorporate some physical activity into the math.

Fast Walker

With the weather getting much nicer out (Thursday was a high of 25 degrees C), I wanted to take the kids outside. Sometimes the easiest of things can generate a pretty good activity. The joy of grade 9 is that one of the main concepts is Linear Relations. There are so many things out there that involve some type of a linear relation.

fastwalker1.png

Lots of great things in here (proportions, rate, linear relations, solving equations, unit conversions, graphing). I’ll likely continue this on Monday and talk about having two people walk with different rates (or maybe a race between the tortoise and the hare). How much of a head start should the tortoise have? I might also try to incorporate some distance-time graphs into this activity. If you walk around the track half way, stop to tie your shoe, and continue to walk, how would the graph look now? What if you walk 3/4 of the way, turn around and come back to the start?

PD Day

We had a PD day on Friday which was to focus on math. Four of us were out of the school on Friday to mark the math contests for the CEMC at the University of Waterloo. We had left 5 activities for the teachers in our school to try out:

Looks like it was a pretty good time!

tweet

See math can be fun and isn’t always this:

mathclass

Grade 9 Academic Update

I hope everyone is having a fantastic Easter weekend!

Distributive Property

We started this week looking at the distributive property. We began with an activity about combos at McDonalds from Henderson Math.

The students seemed to understand this really well so we moved to looking at examples with variables and exponents. Mr. Corrigan and I created an activity to practice distributive property.

dist

It involved drawing 4 cards to place in the blanks. We chose cards so we could get positive and negative numbers. Students then rolled a die 3 times to determine the exponents. It worked really well!

Standard Form of a Line

Up until now, we have only looked at y = mx + b. The academic course requires students to look at the standard form and be able to convert from standard to slope-intercept.

We started creating simple linear equations from a word problem.

standard1

I wanted them to practice rearranging a formula in part (c).

We then looked at how to graph a line in standard form using the x & y intercepts or converting to slope-intercept form.

Students then circulated the class where I had put 10 questions up for them to do on the VNPS and we rotated through them as a station activity.

Filler Up

On Friday we worked through the Water Balloon Mishap activity from Jon Orr. We will continue this activity on Tuesday and look at extending it to a leaking balloon and creating some graphs and linear equations.

Week 8 of Grade 9 Academic

Trashketball Day 1 – 3

This week we worked through the spiralled lesson presented by Jon Orr. We followed the lesson pretty much exactly. The first day involved determining how many trashketballs would fill the box. It was our first look at a volume of a sphere. Day 2 involved shooting practice and determining our shooting rate and on day 3 we raced and compared our shooting rate with a partner.

Trashketball Day 4

We added a day 4 to this lesson which involved seeing how many we could sink from various distances in 30 seconds.

table

The students collected their data and then created a scatter plot and a line of best fit. They found the equation and were asked to solve some questions using their equation.

trash

Students really enjoyed this lesson and I think they got a lot out of it.

Asking Good Questions

I’ve been trying to avoid the “this question is too hard” mentality and just giving them the question anyways. Day 3 of trashketball involved determining when you and your partner would be tied and how much of a head start they would need. As a warm up, I gave them the following question

whiteboard.png

Students tackled the problem. Multiple different strategies were used. Some used brute force, some used trial and error, and one group managed to solve using the two equations. We had a great talk about efficiency and precision. Most said they would have around the same amount of water around 30 seconds. Close, but not the exact answer. Good thinking here nonetheless.


Week 7 of 9 Academic

Angles & Equations

We began this week with a great activity I found from Mrs. Newell. We previously worked with equations and angle properties and this was an amazing consolidation of both!

week72

Students cut out the pieces (there were 12 of them) and then solved the angle problem and put them in the correct order to make a puzzle. Some challenging questions here, but we were up to it.

Optimizing 2D Shapes

Students worked through the problem of finding the maximum area of a rectangle given a fixed perimeter. Each group received 20 toothpicks and made as many rectangles as they could. I also had them plot a scatter plot of area vs. length. This was our first look at a non-linear graph so that worked out well.

We also explored minimum perimeter and a rectangle with only 3 sides.

Review & Cycle Test

The literacy test was this week. We spent the period reviewing for the cycle test on Friday. The students seem far more confident in their mathematical abilities than in my previous experience. We have also covered a lot of the expectations considering we have only done 2 cycles. The plan is to do 3 more cycles of roughly 15 days each. My hope is to have covered the material by the end of the next cycle and spend the last two cycles going into deeper understanding and greater breadth.

I use the word “covered” here loosely as I much prefer Alex Overwijk’s thought of uncovering the expectations not covering the expectations.